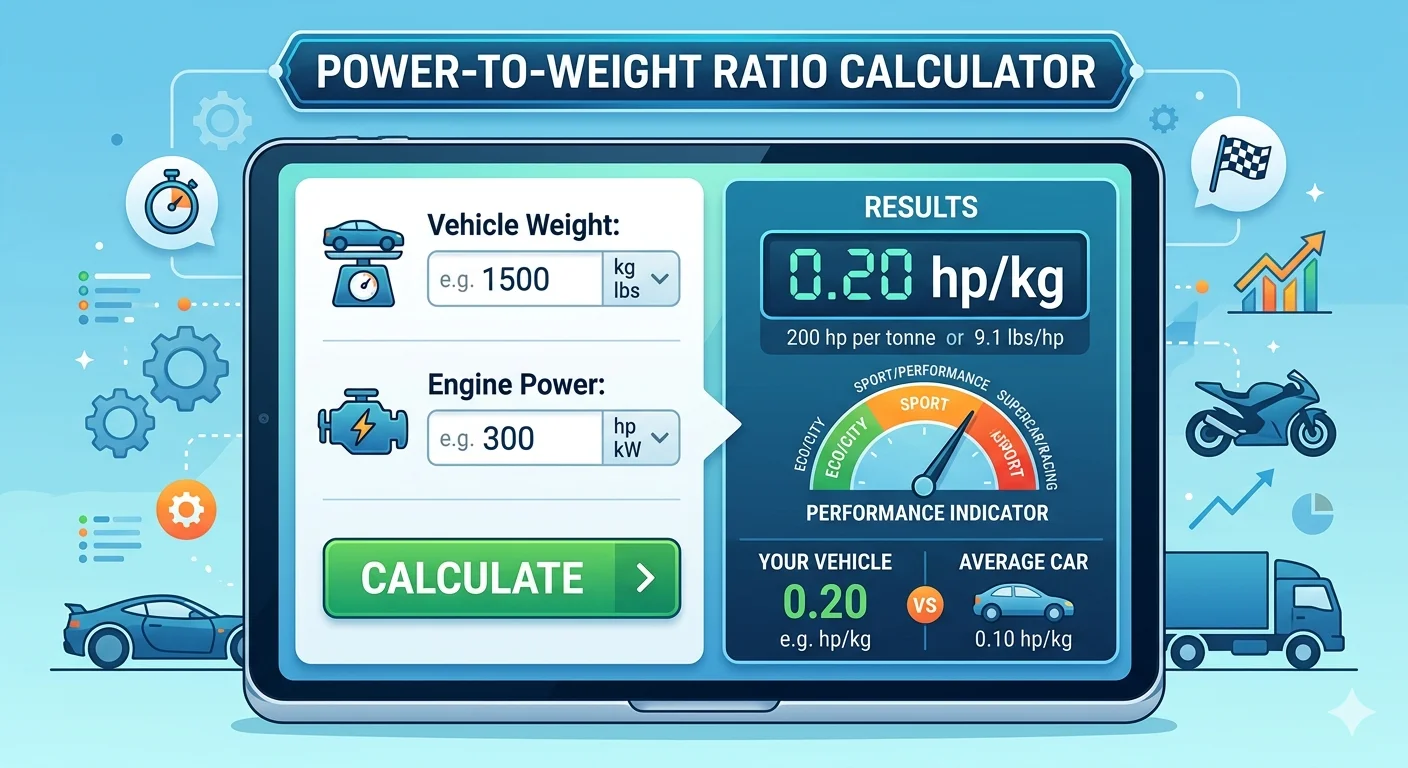
Power-to-Weight Ratio Calculator
Calculate your vehicle's power-to-weight ratio, estimated 0-60 mph time, and performance class. Enter your vehicle's specs below.
Performance Class Distribution
Most calculated vehicle performance tiers
Power-to-Weight Ratio Ranges
Common power-to-weight ratio ranges calculated
Calculation Statistics
See how many power-to-weight calculations have been made over time
Power-to-Weight Guides & Articles
Power to Weight Ratio Calculator: Cars and Cyclists
Whether you drive a supercar, pilot a motorcycle, build an EV, or grind out watts on a road bike, one number cuts through all the marketing noise and tells you exactly how fast something will go: power to weight ratio. Enter your figures above and find out where your machine, or your legs, actually stand.
Why Raw Horsepower Is Lying to You
A 300hp car sounds more impressive than a 200hp car. Until you find out the first one weighs 2,000kg and the second weighs 1,000kg. At that point, the 200hp machine will leave the heavier car standing at every stoplight, every corner exit, and every on-ramp. This is the core truth that power to weight ratio exists to expose.
Newton's Second Law gives us the physics: Force equals mass times acceleration, or F = ma. Rearrange for acceleration and you get a = F/m. Acceleration is what you feel when a car presses you into your seat, and it depends not just on force (which your engine produces) but on how much mass that force must move. Double the power and you double the acceleration. Halve the weight and you achieve exactly the same result. PWR treats both levers equally, which raw horsepower never does.
Take two real cars: the Lotus Elise with around 200hp and a kerb weight of just 700kg versus the Dodge Challenger at roughly 370hp but tipping the scales at 1,900kg. The Challenger has 85 percent more power on paper. Yet the Lotus produces a PWR of approximately 0.286 hp/lb, while the Challenger comes in near 0.197 hp/lb. The Lotus wins decisively. Power to weight ratio is the single most honest number available for comparing vehicle performance across classes, categories, and price points.
The Problem With Quoting Horsepower in Isolation
Manufacturers know that big horsepower numbers sell cars. A 500hp badge on a heavy luxury SUV moves metal on the showroom floor, even when that same 500hp is being dragged down by 2,400kg of metal, leather, and infotainment screens. Quoting horsepower without weight is like quoting salary without mentioning cost of living: the number sounds good but tells you almost nothing about real-world performance. PWR closes that gap instantly.
One Simple Calculation, Every Answer You Need
The formula behind every result this calculator produces is a single division. Take your power output and divide it by the weight of the vehicle or rider. The unit you end up with depends on which system you use, but the maths is identical every time.
Example 1, Porsche 911 GT3: 502hp, 3,126 lbs. Divide 502 by 3,126 and you get 0.161 hp/lb. Convert that to the more visual hp/ton figure and it comes out at approximately 264hp per tonne, which puts it firmly in serious sports car territory.
Example 2, Tour de France cyclist: A climber holding a functional threshold power of 400 watts at a body weight of 70kg produces 400 divided by 70, which equals 5.71 W/kg. That is elite climbing territory and the kind of number that wins mountain stages.
Converting Between Imperial and Metric Power to Weight Units
To convert hp/lb to kW/kg, multiply by 1.6438. To go from kW/kg back to hp/lb, multiply by 0.6083. If you work in hp/tonne (the common British motoring press unit), divide your horsepower by the vehicle weight in tonnes. This calculator handles all unit conversions automatically, so you can enter any combination and receive every output at once.
What Every PWR Number Actually Feels Like from the Driver's Seat
Numbers only mean something when you can attach a sensation to them. Here is a practical guide to every power to weight bracket, from grocery-getter territory up to hypercar insanity, with real-world vehicles at each level so you know exactly where your machine sits.
0.05 hp/lb
Heavy trucks, loaded vans, and base-spec economy cars occupy this range. Performance is adequate for the task at hand and nothing more. Merging onto a motorway requires planning. Real examples: Toyota Corolla 1.6 base trim, Ford Transit cargo van.
The majority of family cars and compact crossovers land here. You can merge safely, overtake with confidence on A-roads, and never feel embarrassed. It is unremarkable but competent. Real examples: Honda Civic 1.5, VW Golf 1.5 TSI.
Hot hatches, sporty saloons, and entry-level sports cars inhabit this bracket. There is a tangible shift in energy: the throttle feels alive, overtakes arrive quickly, and the car rewards a driver who wants to use the full rev range. Real examples: Ford Focus ST, BMW 330i.
This is where cars earn the "sports car" label without qualification. Acceleration is genuinely rapid, track days become natural habitat, and the gap to ordinary traffic is obvious. Real examples: Porsche 911 Carrera, Chevrolet Corvette C8.
Acceleration is startling for any driver encountering it for the first time. Tires work hard, reaction times matter, and the margin for error shrinks considerably. This is weekend warrior territory demanding respect. Real examples: Ferrari 488, McLaren 570S.
Neck-snapping acceleration that is genuinely difficult to deploy fully on a public road. These figures belong to machines built around performance as a singular purpose, with everything else stripped away or subordinated. Real examples: Bugatti Chiron, Ariel Atom, BAC Mono.
Calculate your size volume and percentile now: Size Volume & Percentile Calculator
W/kg: The Performance Currency That Every Serious Cyclist Trades In
In competitive cycling, watts per kilogram is not just a training metric. It is the universal benchmark that separates categories, predicts race outcomes, and tells a rider exactly how much work remains between their current fitness and the next level. Unlike cars, where weight reduction is expensive and power gains require engine work, cyclists can move both levers simultaneously through training and body composition.
Casual and new cyclists who ride for enjoyment and health. Group rides are possible but expect to find the back of the bunch on any serious climb. This is a perfectly valid place to be if racing is not the goal.
Riders who train consistently two to four times per week. Club rides are manageable at a reasonable pace, and sportives become genuinely enjoyable events rather than survival exercises. Improvement here comes quickly with structured training.
Local and regional racing becomes viable. Riders in this bracket have done the training work and see visible improvement in timed climbs and group ride dynamics. This range requires dedicated, structured effort over months and years.
Serious contenders in amateur racing at the highest non-professional levels. Most dedicated amateur cyclists will never exceed this bracket regardless of the hours invested, and reaching it represents a genuine athletic achievement.
Check snow day chances by state: Snow Day Predictions by State
Riders earning a living from racing, competing in national championships and continental-level events. The jump from 4.5 to 5.5 W/kg represents years of professional-level training, recovery management, and optimised nutrition.
The absolute elite. Tadej Pogacar and Jonas Vingegaard operate in this range during Grand Tour mountain stages. Numbers above 6.2 W/kg over extended durations represent the physiological ceiling of human cycling performance.
To improve your W/kg, work both sides of the equation. Increase your functional threshold power through structured interval training, particularly sweet spot and VO2 max sessions. Reduce body weight through gradual, sustainable fat loss and lean muscle development. Crash dieting destroys the muscle you need to produce power and sends your W/kg in the wrong direction.
Why Motorcycles Demolish Cars on Power to Weight: The Weight Equation Explained
A 600cc motorcycle engine would be considered modest in almost any car. Yet that same engine, installed in a machine weighing under 200kg, produces a power to weight ratio that embarrasses vehicles with three times the displacement. The secret is not the engine. It is the diet.
The Honda CBR600RR produces approximately 120hp from its 600cc inline-four. At a wet weight of around 187kg, that translates to roughly 0.29 hp/lb, a figure that comfortably clears the hypercar threshold used to categorise road cars. The Kawasaki Ninja H2R takes this logic to its extreme: a supercharged 998cc engine producing over 300hp in a machine weighing around 216kg delivers a PWR above 0.65 hp/lb. That is a number that makes many purpose-built racing cars look pedestrian.
This is why a rider on a 600cc sportsbike routinely beats a V8 muscle car to 60 mph in a straight line. The muscle car might have double the engine displacement and more peak horsepower, but it is also dragging 1,600kg of steel, glass, and comfort equipment that the motorcycle simply does not carry. In Australia, the LAMS (Learner Approved Motorcycle Scheme) restriction caps learner-legal bikes at 150kW per tonne precisely because unrestricted motorcycle PWR figures are too demanding for inexperienced riders to manage safely.
Losing Weight Beats Gaining Power on a Motorcycle Every Time
For most motorcycle riders looking to improve performance, stripping weight from the bike delivers a better return than chasing power upgrades. Replacing a stock exhaust with a titanium unit, fitting lightweight wheels, and removing unnecessary bodywork can reduce a motorcycle's mass by 10 to 15 kilograms. At a PWR of 0.25 hp/lb, that weight saving is equivalent to adding 6 to 8 horsepower at zero cost in engine stress, reliability risk, or tuning complexity.
Electric Vehicle PWR: Exceptional Numbers, With One Catch
EVs regularly produce power to weight ratios that sit in supercar and hypercar territory, and they do it while carrying the weight of a family saloon. The Tesla Model 3 Performance, for example, produces around 450hp at a kerb weight of approximately 1,847kg. That calculates to roughly 0.24 hp/lb, placing it in the same bracket as a Ferrari 488. Off the line, the Tesla will match or beat many cars costing three times the price.
The reason EVs punch so hard on PWR is instant torque delivery. An electric motor produces its maximum torque at zero RPM, meaning full force is available the moment the accelerator is pressed. An internal combustion engine must climb through its rev range to find its power band, costing time in exactly the window where the EV is already accelerating hard.
However, EV PWR numbers carry an important caveat. The peak power figure used in PWR calculations is often available for only a short burst before thermal management systems reduce output to protect the battery and motor. Sustained power, over multiple back-to-back acceleration runs or during long high-speed motorway driving, is typically lower than the headline figure. Battery weight is the other variable: large capacity packs add 400 to 600kg to the vehicle, which is the primary reason why even the fastest EVs do not reach the extreme PWR figures of the lightest petrol supercars.
Read our will it be a snow day tomorrow guide: Will It Be a Snow Day Tomorrow
Peak Power Versus Sustained Power: The EV PWR Number You Are Not Being Shown
When an EV manufacturer quotes horsepower, they are quoting peak output, available for a matter of seconds under ideal battery temperature conditions. Sustained power, the figure that determines real-world performance across a full track session or a long mountain pass, is meaningfully lower once thermal limits activate. For accurate real-world PWR comparison between EVs and internal combustion cars, look for independently tested sustained output figures rather than relying on manufacturer peak power claims alone.
How Power-to-Weight Ratio Works
- Formula: Power-to-Weight Ratio = Horsepower / Weight (in lbs or kg)
- HP per lb: Higher values mean better acceleration and performance
- HP per kg: Multiply HP/lb by 2.205 to get HP/kg ratio
- 0-60 Estimate: Derived from power-to-weight ratio with drivetrain adjustment
- Performance Classes: Economy (<0.04), Standard (0.04-0.07), Sport (0.07-0.10), Performance (0.10-0.15), Supercar (0.15-0.25), Hypercar (>0.25)
- Weight Matters: Reducing weight by 100 lbs can improve 0-60 time by ~0.1 seconds
Frequently Asked Questions
For a road car, anything above 0.10 hp/lb is considered solidly quick, and most drivers will find this more than enough for everyday roads. The enthusiast sweet spot begins around 0.12 to 0.15 hp/lb, where cars start to feel genuinely sporting rather than merely adequate. Above 0.20 hp/lb, you are in performance territory that requires experience to fully manage, and above 0.25 hp/lb the car becomes a specialist machine that rewards skill and demands respect. The "good" number depends entirely on what you intend to do with the car.
PWR is strongly correlated with 0-60 time but is not the only factor. Traction, gearing, aerodynamics, tyre compound, and launch technique all play significant roles. As a rough working guide, a car producing 0.10 hp/lb typically runs 0-60 in around 7 to 8 seconds; at 0.15 hp/lb that drops to roughly 5 to 6 seconds; at 0.20 hp/lb you are looking at 4 seconds or less. EVs with high PWR often beat their predicted 0-60 times because instant torque delivery eliminates the time lost building through the rev range.
The formula is: PWR = Power Output divided by Mass. In imperial units: PWR (hp/lb) = horsepower divided by weight in pounds. In metric units: PWR (kW/kg) = kilowatts divided by weight in kilograms. For cyclists: PWR (W/kg) = watts divided by body weight in kilograms. Always use the same unit system throughout the calculation. To convert between systems, 1 hp/lb equals approximately 1.6438 kW/kg. The key is consistency: mix units and your result will be meaningless.
For a recreational cyclist, reaching 3.0 W/kg is a meaningful and achievable goal that will transform your experience on group rides and sportives. Getting there from 2.0 W/kg typically takes six to twelve months of consistent, structured training. If you want to compete at local club racing level, targeting 3.5 to 4.0 W/kg is appropriate. Avoid obsessing over your W/kg number before you have at least a year of consistent training in the bank. Building the aerobic base comes first; the number follows.
Weight reduction almost always delivers better value than power upgrades. Removing spare tyres, rear seats, and unnecessary interior trim costs little and can save 30 to 50kg. Lightweight wheels reduce unsprung mass, which improves both handling and effective PWR. If your car carries multiple people regularly, the single largest variable in your real-world PWR is the number of passengers. On the power side, a professional ECU remap on a turbocharged engine typically costs less than suspension work while delivering 10 to 20 percent more power without any mechanical changes.
Because mass is the dominant variable, and motorcycles have almost none of it. A litre-class sportsbike typically produces 180 to 200hp and weighs around 200kg. A V8 muscle car might make 450hp but weighs 1,800kg. The motorcycle's PWR is roughly 0.40 hp/lb versus the car's 0.25 hp/lb. More force acting on nine times less mass produces dramatically higher acceleration. Traction is the only limiting factor, which is why experienced motorcycle riders use careful throttle control off the line rather than simply pinning the throttle.
Use kerb weight (the vehicle with fluids and standard equipment but no passengers or cargo) for standard vehicle comparisons and manufacturer benchmarking. This ensures like-for-like comparison across vehicles. If you want a real-world figure that reflects actual driving conditions, add the weight of the driver and any regular passengers. For track day preparation or performance tuning decisions, consider using the actual weight of the car as it will be used: fluids full, driver on board, no passengers or luggage. That is your true operating PWR.
On peak PWR, many EVs compare favourably with petrol cars at significantly lower price points. A Tesla Model 3 Performance matches or exceeds the PWR of a Porsche 911 Carrera while costing considerably less. However, the comparison shifts if you look at sustained PWR, track performance over multiple laps, or extreme performance vehicles. The lightest petrol hypercars still hold the highest PWR figures because battery technology has not yet eliminated the weight penalty of large capacity packs. For road driving, EV PWR is increasingly competitive across all price segments.